VISUALIZE
UNDERSTAND
IMPROVE
Interactive Heat Maps
Understand visitor movement.
Make informed decisions.
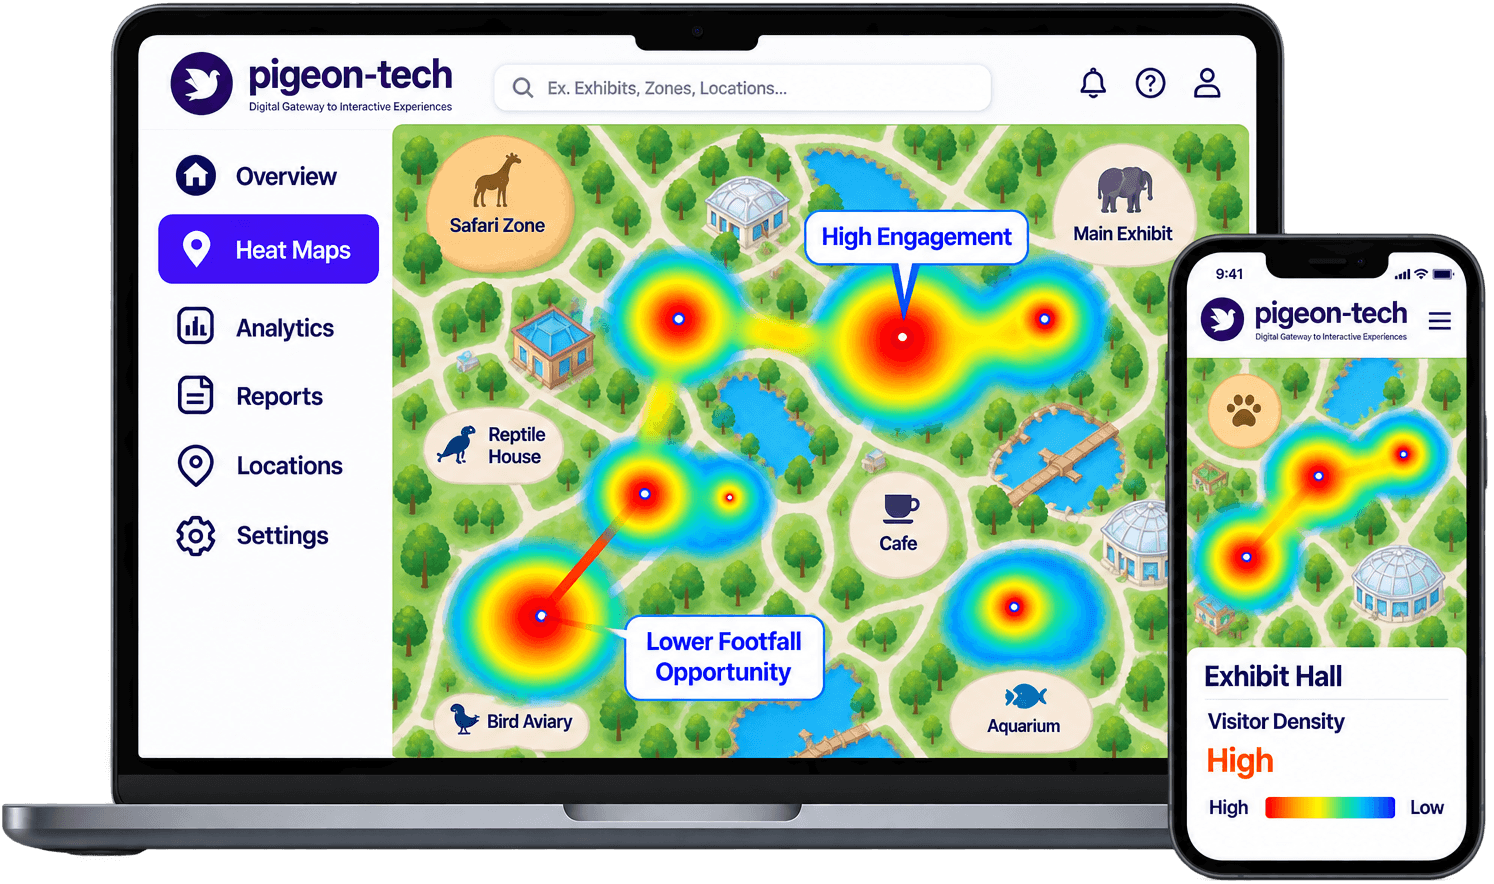
From visitor data to actionable insights
Our interactive heat maps collect and visualize visitor activity to help you understand how spaces are used and identify opportunities for improvement.
Collect Data
Capture anonymized visitor interactions through the app and venue touchpoints.
View Heat Maps
See real-time or historical heat maps on an interactive venue map.
Take Action
Use insights to improve operations, exhibit placement and visitor experiences.
Powerful insights for your venue
A digital heat mapping system designed for real visitor venue operations.
Interactive Heat Maps
Visualize visitor activity across indoor and outdoor maps.
Visitor Flow Analysis
Understand movement patterns and popular areas.
Real-Time & Historical Views
View current activity or analyze trends over time.
Operational Insights
Identify opportunities for staffing, signage and space planning.
See your venue from a new perspective
Interactive heat maps highlight where visitors go, how they move, and which areas get the most engagement.
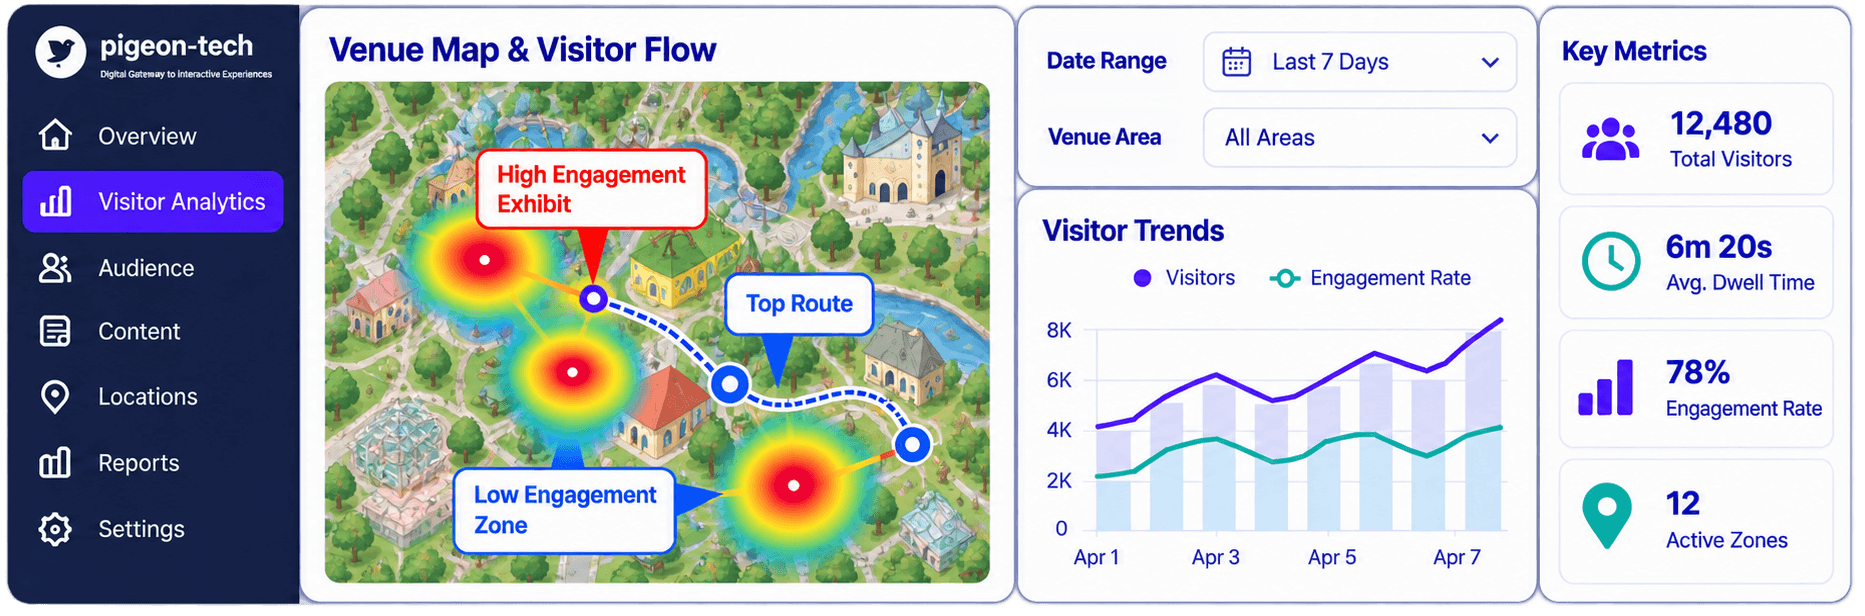
Value for Visitors and Venue Teams
For Visitors
For Venue Teams
Explore Related Pigeon-Tech Features
Understand visitor behaviour
Help visitors find their way
Collect visitor insights
Your brand, our technology
See Interactive Heat Maps in Action
Frequently Asked Questions
Interactive heat maps are visual tools that show where recorded visitor activity is more or less concentrated across a venue map.
In Pigeon-Tech, a heat map can help venue teams interpret patterns from configured visitor interactions, location signals, or other supported data sources. Areas with greater recorded activity can appear more prominent, while areas with less activity can be easier to identify.
The purpose is to help teams understand how spaces are being used and where additional investigation or improvement may be useful.
The data used to create a visitor heat map depends on the technologies and analytics configured for the venue.
Depending on the deployment, heat maps may use supported signals such as:
1. App interactions
2. Zone activity
3. Location or positioning data
4. QR, NFC, beacon, or other configured interactions
5. Map and destination activity
6. Session or engagement data
The exact data source should be defined during implementation so the venue understands what the heat map represents.
A heat map should not be interpreted as a complete picture of every visitor unless the underlying data and coverage support that conclusion.
Interactive heat maps can support both indoor and outdoor visitor environments, but the way activity is captured may differ by venue.
Outdoor attractions may use GPS or other available location signals, while indoor environments may require different positioning or interaction technologies depending on the use case.
Pigeon-Tech should define the appropriate data source, coverage, and accuracy for each deployment before heat-map reporting is configured.
Relevant environments can include: museums, zoos, aquariums, theme parks, fairs, festivals, and other visitor venues.
Pigeon-Tech can support current or historical heat-map views when the required data is available and configured for the deployment.
Historical heat maps can help teams compare activity across different dates, events, programs, or operational periods.
If real-time or near-real-time views are required, the availability depends on the underlying data source, refresh frequency, network connectivity, and system configuration.
The page should only describe a heat map as “real-time” when the actual implementation supports that level of data freshness.
Heat maps can help venue teams identify patterns that may support operational decisions.
For example, teams may use heat-map insights to:
1. Compare activity across zones
2. Identify areas with relatively higher or lower recorded activity
3. Review exhibit or attraction placement
4. Evaluate signage or visitor information
5. Plan staffing or operational attention
6. Compare activity before and after changes
A heat map provides a visual signal for further analysis. It should be combined with other data, observations, and visitor feedback before making major operational decisions.
Heat maps are generally intended to show patterns of activity rather than visually identify individual visitors.
Pigeon-Tech heat-map reporting should use the level of aggregation and data handling agreed for the deployment. The information shown may represent grouped activity by area, zone, time period, or interaction type.
If identifiable or account-linked data is used elsewhere in the visitor experience, access and use should be governed by the organization’s data requirements and the agreed implementation.
The appropriate privacy and data-handling approach depends on what information is collected and how the solution is configured.
Pigeon-Tech should define:
1. What data is collected
2. Whether it is anonymous, aggregated, or account-linked
3. How long it is retained
4. Who can access it
5. How it is used within the visitor experience and analytics environment
Venues should review the deployment against their own privacy requirements and applicable laws before launch.
Avoid making broad compliance claims unless the specific implementation and legal requirements have been validated.
Heat maps do not always require a third-party integration, but they do require a reliable source of visitor activity or location data.
Depending on the use case, the solution may use data from:
1. The Pigeon-Tech app or web experience
2. Interactive maps
3. Location or positioning technologies
4. QR or NFC interactions
5. Beacons
6. Ticketing or membership systems
7. Other approved third-party platforms
The required integrations depend on the venue, the type of heat map, and the level of detail the organization wants to measure.
Visitor heat maps are one visual way to understand where recorded activity is occurring across a venue, while visitor analytics is the broader set of data and reports used to understand visitor behavior and engagement.
Visitor analytics may include:
1. Content engagement
2. Navigation activity
3. Zone interactions
4. Dwell time
5. Survey responses
6. Event or program engagement
7. Game or quiz participation
8. Heat-map views
Heat maps therefore work best as one part of a broader visitor analytics strategy.
Explore Visitor Analytics